
Table 1: Key
indicators on EU manufacturing industry (NACE Section C)
|
|
Main indicators
|
Value
|
Number of enterprises
|
2,100,000
|
Number of persons
employed
|
30,000,000
|
Turnover million €
|
€ 7,080,000
|
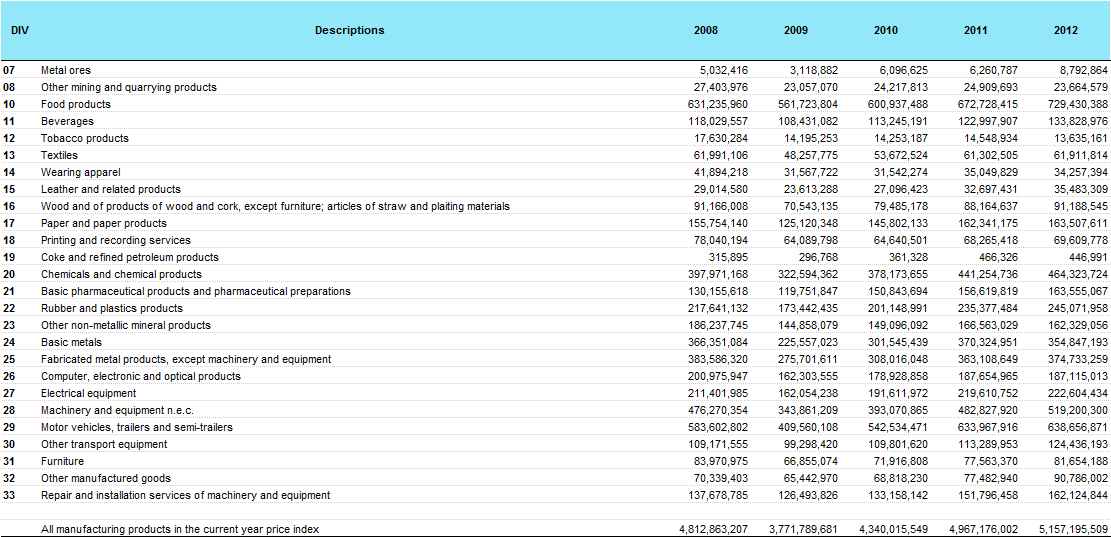
The European Commission gives the total turnover figure for the European defence industry as € 97.3 billion in 2014, “making it a major contributor to EU growth.” But with a total manufacturing turnover of about 7 trillion in 2012 for the EU as a whole (see table 1: latest available figure) the defence industry turnover is less than 1.4% of total EU value, which is not really a 'major' contribution. This apart from the fact that defence production and notably research is very dependent on financial support from governments (who are also the main clients) thus this growth comes at a price. The Commission also claims that the sector is an important supplier of jobs. A study of the European Parliament puts the job argument in perspective: The LoI+ defence industries “employ about 520,000 people. This represents only 0,024% of the total workforce in the EU 27.” The defence industry is payed by public money. In return it provides 'security' and state-sponsored, expensive jobs.
What about another claim of the Commission, that the defence industry is ' highly innovative', providing 'cutting-edge research'? This claim is a bit outdated and it is not the complete story. Innovation in the age of bio-, nano-, and information technology is driven by the civil market: the Googles, Samsungs, i-Apples and Microsofts of this world. The 'spin-off effect' by which defence research offers innovative technology to the civil market has turned into a 'spin-inn' by which defence research makes use of the newest civil technology. The administrative board of the Union hasn't fully missed this development and hides a short sentence in a haystake of innovation language: “Innovation for defence is increasingly coming from the civil sector.” But according to the Commission, we can't look into the future thus the sector remains important for technology innovation. Not the strongest argument to redirect part of the EU research budget to the defence industry, as is the plan for the 2017 EU budget line.
What is the source of the Commission's figures on the EU defence industry turnover? How did it filter the € 97.3 billion out of general economic figures of Eurostat, the statistic bureau of the Union? Well, it didn't. Figures on defence industry used for the policy making of the European Commission come from the defence industry itself, in this case from the AeroSpace and Defence Industries Association of Europe (ASD). This lobby organisation is very close to the European Union's institutions and represents most (but not all) major EU and UK arms manufacturers and national defence associations, as well as civil aviation. ASD provides annual information on the defence industry in a fancy designed Facts & Figures infosheet. This information covers the EU plus Turkey, Norway and Switzerland, the latter countries considered part of the European Union defence market policy.
Interestingly the European Parliament is using other figures in one of its reports. They calculate the defence (industrial) turnover in Europe at roughly € 81 billion, based on LoI countries turnover in a unspecified year, approximately 2011.
Somehow the € 97.3 billion turnover figure for defence production does not fit with a reported licensed arms export value of € 98,400,451,437 for EU countries (minus Turkey, Norway and Switzerland) in the 17th annual (2014) report on exports of military technology and equipment. This can be explained from a gap between licenses granted and actual exports. Licenses must be seen as a procedural political backing for arms exports, not as the value of the materialised exports. Actual exports depend on the rules of the market and international relations. They may be cancelled or postponed and thus differ from the value of licenses. In 2014 the value of materialized exports was much lower than that of granted licenses, namely € 14,017,250,941. This € 14 billion is completely in line with an average percentage of 10-20 percent of defence production. On the license side, notably France overestimated its own position (€ 73.3 bn. of licenses versus € 3.8 bn. of exports). And some countries (UK, Italy for example) do not report their actual exports, so the figures can not be accurate.
When figures are not accurate it is useful to compare different sources. Another figure can be deduced from the Defense News top-100 of largest global defence firms. The defence revenues of the 29 EU+ companies (there is also a slightly different SIPRI list) have a combined turnover of just over 90 billion euro's (US$ 101.7 billion, see table 2). In a study of the European Parliament it is estimated that the biggest five companies concentrate 2/3 of the turnover, an estimation which is probably too high. Remarkable is that well known names such as Belgium FN Herstal, German Heckler und Koch, Dutch Shipyard Damen, French Panhard, Italian Beretta, Polish Bumar Group, Santa Bárbara from Spain etc. do not appear in the Defence News top-100. As they all produce complete weapon systems like naval vessels, tanks, missiles, rifles, armoured vehicles etc. we should add them to have a full picture. Other European companies, such as Bofors Weapons Systems, are part of US conglomerates and thus no part of the top-100 EU+ total, although production takes place in Europe. They are not included in table 2 which is thus still an estimate.
Table 2: European
defence companies in Defense News top 100
|
||||||
rank
2014
|
company
|
country
|
2014
defence revenue (in $ millions)
|
%
defence rev. compared to 2013)
|
2014
total rev. (in $ millions)
|
%
rev. from defence
|
3
|
BAE
Systems
|
UK
|
25,449.0
|
-9.2
|
27,411.3
|
92.8
|
7
|
Airbus
Group
|
Netherlands
(*)
|
14,609.5
|
-11.7
|
80,686.4
|
18.1
|
9
|
Finmeccanica
(**)
|
Italy
|
10,561.4
|
-3.1
|
19,486.8
|
54.2
|
12
|
Thales
|
France
|
8,461.6
|
-22.8
|
17,242.2
|
49.1
|
15
|
Rolls-Royce
|
UK
|
5,433.7
|
-11.3
|
24,035.3
|
22.6
|
20
|
Safran
|
France
|
4,081.3
|
1.3
|
20,406.5
|
20.0
|
21
|
DCNS
|
France
|
4,074.7
|
-11.5
|
4,074.7
|
100.0
|
25
|
Babcock
International
|
UK
|
3,558.8
|
3.9
|
7,14.2
|
48.0
|
28
|
Rheinmetall
|
Germany
|
2976,9
|
0.8
|
6,230.3
|
47.8
|
30
|
Saab
|
Sweden
|
2,829.3
|
-4.0
|
3,438.5
|
82.3
|
43
|
Serco
|
UK
|
2,174.8
|
2.4
|
7,826.1
|
27.8
|
47
|
Cobham
|
UK
|
1,860.0
|
-2.5
|
3,051.4
|
61.0
|
56
|
Fincantieri
|
Italy
|
1,406.8
|
-8.8
|
5,845.8
|
24.1
|
57
|
Nexter
|
France
|
1,392.8
|
29.2
|
1,392.8
|
100.0
|
58
|
Dassault
Aviation
|
France
|
1,332.3
|
-30.7
|
4,890.6
|
27.2
|
62
|
Aselsan
|
Turkey
|
1,109.0
|
10.7
|
1,142.5
|
97.1
|
65
|
QinetiQ
|
UK
|
1,017.9
|
-20.8
|
1,288.4
|
79.0
|
67
|
GKN
Aerospace
|
UK
|
990.2
|
-0.3
|
3,667.6
|
27.0
|
68
|
Ultra
Electronics
|
UK
|
951.5
|
2.1
|
1,174.7
|
81.0
|
70
|
Krauss-Maffei
Wegmann
|
Germany
|
934.6
|
-14.7
|
934.6
|
100.0
|
71
|
Kongsberg
|
Norway
|
929.8
|
-26.9
|
2,644.0
|
35.2
|
75
|
Meggitt
|
UK
|
888.7
|
-12.5
|
2,559.9
|
34.7
|
78
|
Turkish
Aerospace Industries
|
Turkey
|
853.6
|
8.3
|
1,001.0
|
85.3
|
85
|
Chemring
|
UK
|
723.7
|
-25.6
|
786.6
|
92.0
|
86
|
Ruag
|
Switzerland
|
718.4
|
-4.3
|
1,670.8
|
43.0
|
88
|
Indra
|
Spain
|
676.0
|
-0.3
|
3,904.4
|
17.3
|
90
|
Diehl
Defence Holding
|
Germany
|
648.5
|
-11.2
|
4,038.9
|
16.1
|
94
|
Patria
|
Finland
|
555.8
|
-45.9
|
614.5
|
90.4
|
97
|
Nammo
|
Norway
|
527.4
|
-0.5
|
591.6
|
89.1
|
Total
EU+
|
101,728.0
|
259.452.4
|
(***)
39%
|
|||
Total
global top 100
|
385,660.2
|
122,9470.2
|
31.37
|
|||
notes:
*)
Operational headquarters in Paris and Munich, based in Netherlands
for juridical and tax reasons.
**)
New name Leonardo.
***
Although the top of the list companies have smaller defence
production the figure will remain the same in 2015 (39.10%)
Source:
Defense top 100 for 2014 and 2015. See:
http://people.defensenews.com/top-100/
|
||||||
There are numerous pitfalls in composing a total added value figure. Accuracy is also hampered by the fact that the EC gives only an overall figure and no information on individual EU+ nations, but some countries mainly produce components. The largest Dutch military export in 2014 (€ 700 million) e.g. was a significant export of components to the US, Italy and Turkey for assembling the F-35 Joint Strike Fighter. But components are produced, exported and assembled somewhere else and then exported again as complete platform or again as part of a platform. There is the danger of double counting of added value. In general the method to prevent this is based on measuring the value added, but this can only be applied if the information is at hand.
Estimates, unconsolidated figures, different groups of countries, incomplete reports; defence-industrial figures are not as solid as they seem. In the 2015 European Parliament report The extra-EU defence exports’ effects on European armaments cooperation, researcher Beraud-Sudreau tries to fix this with a research formula to define the required information: Total turnover = National defence equipment spending + (estimated) Exports – (estimated) Imports. In the 2015 EP study a pie chart per LoI country turnover is divided into domestic, EU and extra-EU markets, based on SIPRI TIV information. (It is a pity the report applies the formula only on the LoI+ countries and not for example on the Netherlands, which in the given period is a larger arms exporter than Sweden.)
 However the formula is applied to estimated export and estimated import figures from the SIPRI trend indicator value (TIV) which gives multi-annual trends. It is problematic to compared trends with an annual figure
such as National defence equipment spending. More solid financial
information is necessary. This could be provided by national
governmental organisations such as the Dutch Commissariat Military Production (CMP).
It is uncomfortable that the European Commission relies on figures
coming from a defence industry lobby organization. To develop public
policies we need controllable information from government sources. It should be not too difficult for Member States to provide these.
However the formula is applied to estimated export and estimated import figures from the SIPRI trend indicator value (TIV) which gives multi-annual trends. It is problematic to compared trends with an annual figure
such as National defence equipment spending. More solid financial
information is necessary. This could be provided by national
governmental organisations such as the Dutch Commissariat Military Production (CMP).
It is uncomfortable that the European Commission relies on figures
coming from a defence industry lobby organization. To develop public
policies we need controllable information from government sources. It should be not too difficult for Member States to provide these.| Table 3: Specification of the Dutch defence and security (D&S) related industry | |
| Feature | |
| Number of companies in D&S |
354
|
| D&S related turnover in 2014 |
€ 4.54 billion
|
| D&S-related turnover as % of total turnover |
15%
|
| Volume of D&S related exports |
€ 3.09 billion
|
| Number of D&S related positions |
24,800
|
| Number of D&S related R&D positions |
7,995
|
| Source: Triarii 2016, https://www.rijksoverheid.nl/documenten/rapporten/2016/03/22/eindrapport-039-nederlandse-defensie-en-veiligheidsgerelateerde-industrie-2016-039 | |